
Interactive visualization tools transform complex, high-dimensional datasets into intuitive graphical displays. These open-source software components make it easier to spot patterns, gain insights, and communicate findings effectively. They enable other Bioinformatics tool developers to rapidly enhance the resources that they develop.
Browse through the following categories to explore the various original resources we have developed:
Most Popular | Recently Published | Enrichment Analysis | Drug and Target Discovery | Computational Platforms and Workflow Engines | Gene and Drug Pages | lncRNAs | Data Portals | Data Visualization Components | Deprecated
![]()
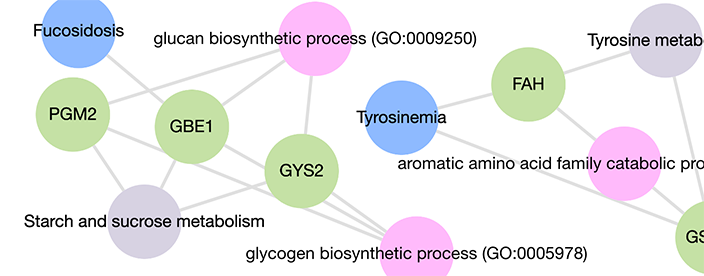
KG-UI
Knowledge Graph User Interface
An open-source UI to create interactive websites from data stored in KG databases. So far, the KG-UI has been applied to the following bioinformatics projects: Harmonizome-KG, Enrichr-KG, ChEA-KG, lncRNAlyzr, Common Fund Data Ecosystem Gene Set Enrichment (CFDE-GSE), ReproTox-KG, Data Distillery KG-UI, and Biomarker-KG.
PMID: 40956607
![]()
Clustergrammer
Web-based Heatmap Visualization and Analysis Tool for High-Dimensional Biological Data
Clustergrammer is a web-based visualization tool with interactive features such as: zooming, panning, filtering, reordering, sharing, performing enrichment analysis, and providing dynamic gene annotations. Clustergrammer can be used to generate shareable interactive visualizations by uploading a data table to a web-site, or by embedding Clustergrammer in Jupyter Notebooks.
PMID: 28994825
![]()
Genes2WordCloud
Identify Biological Themes from Gene Lists
A word-cloud generator and a word-cloud viewer that is based on WordCram implemented using Java, Processing, AJAX, mySQL, and PHP. Text is fetched from several sources and then processed to extract the most relevant terms with their computed weights based on word frequency.
PMID: 21995939