
Starting with the the CPTAC3 clear cell Renal cell carcinoma (ccRCC) dataset, we have developed the interactive visual data exploration portals CPTAC Data Browser and CPTAC Network Exploration Portal. These portals will greatly enhance the sharing of large-scale proteomics resources by allowing researchers to intuitively browse, query, and download data and analysis results from CPTAC projects.
CPTAC Network Exploration Portal
http://ccrcc.cptac-network-view.org/
Selim Kalayci1, 2, Zeynep H. Gümüş1, 2
CPTAC Data Analysis centers are increasingly utilizing network analyses to interpret the massive, multi-scale data that are being generated by the consortium. While there are several network exploration tools available in the field, to share and explore these integrated proteomic datasets and their associated metadata in a user-intuitive way, we need a simple, unified and custom interface that integrates multiple network data types.
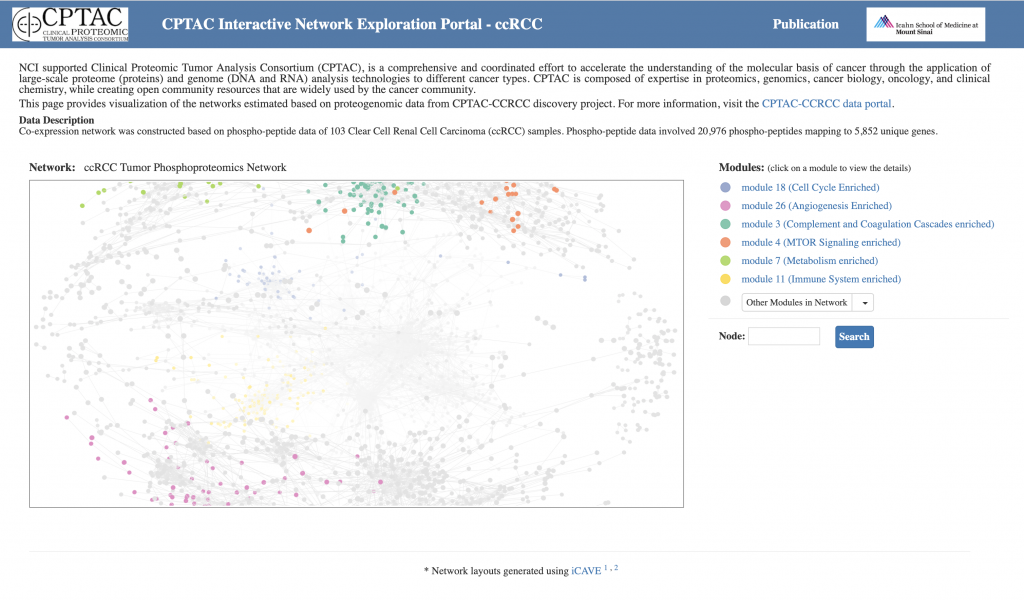
With this web tool, users can interactively explore complex CPTAC networks and modules within these networks in 3D.
Users can also:
(i) display peptides and clinical variables associated with each gene;
(ii) filter the networks based on phenotype
(iii) highlight pathways enriched within network
CPTAC Data Browser
http://ccrcc.cptac-data-view.org
Anna Calinawan1, 2, Boris Reva1, 2
This web application provides comprehensive and granular visualization of CPTAC data as interactive heatmaps. The browser has been implemented for three tumor types, including kidney cancer, lung adenocarcinoma, and pediatric brain tumors. While each portal has been tailored to the needs of the underlying data, they serve the same basic function: enabling users to specify genes of interest and generate an interactive visualization.
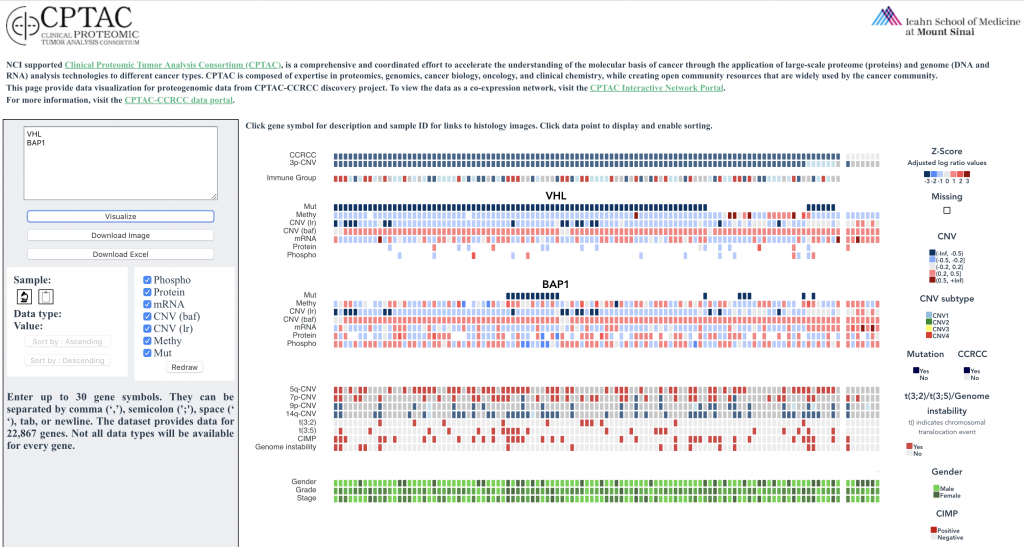
With this web tool, users can render and explore heatmaps with proteome, phosphoproteome, transcriptome, and methylome data.
Users can also:
(i) sort the entire heatmap, in ascending or descending order
(ii) customize which tracks are shown
(iii) export the image and download the data set in exactly the sample order that produced the pattern of interest
(iv) view additional underlying data for each point, including clinical information, links to histologic images, and gene descriptions
1 Department of Genetics and Genomic Sciences, Icahn School of Medicine at Mount Sinai, New York, NY
2 Icahn Institute for Data Science and Genomic Technology, Icahn School of Medicine at Mount Sinai, New York, NY