
Have you ever wondered what your daily movement patterns look like when visualized? Our research team has been collecting Fitbit data as a part of our CPP Tracker Study, and today we’re sharing some fascinating visuals, courtesy of Dr. Jannes Jegminat, who is a postdoctoral research scientist from our group.
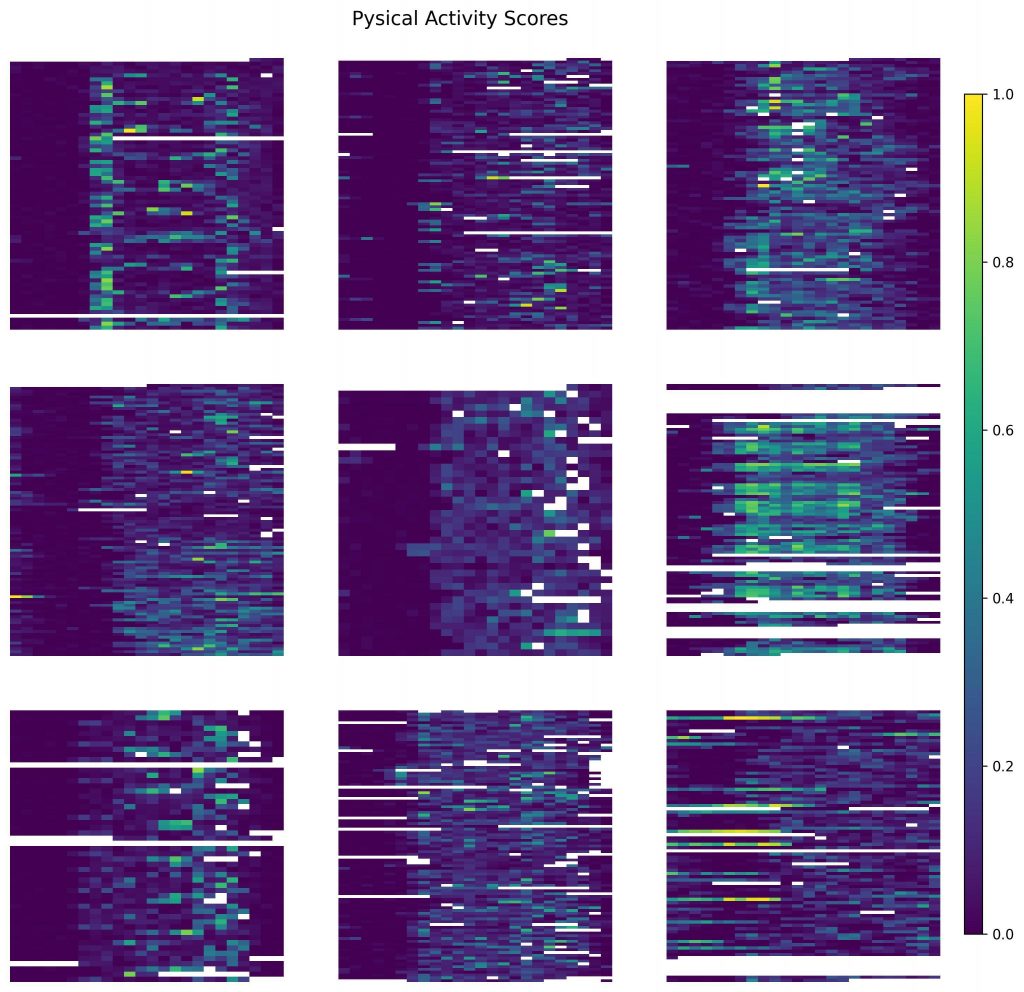 The colorful visualizations you see represent activity patterns from approximately 90 participants in our study. Looking at the larger consolidated heatmap, we see something truly remarkable – a collective visualization representing thousands of hours of real-life data from our participants. Each row represents one person’s data, while each column represents a different hour of the day. The colors range from dark purple (indicating sedentary periods) to bright yellow (showing high activity). These vivid patterns tell a compelling story about living with chronic pelvic pain.
Individual Differences in Activity Patterns
 One of the most striking observations from our data is the remarkable variability between participants. Some heatmaps show consistent activity patterns with regular bursts of movement throughout the day, while others reveal more sporadic activity. For example, some participants demonstrate relatively high activity levels across many days (with valid data for 89.8/94 and 92.3/94 days, respectively). Meanwhile, others show different patterns with fewer data points captured (e.g., 1.8/3 and 1.1/3 valid days).
This diversity highlights an important reality: chronic pelvic pain affects each person differently, and daily activity capabilities vary significantly among individuals. This reinforces our understanding that personalized approaches to pain management are essential.
Daily Rhythm Patterns
Looking across participants, we can identify certain timing patterns in activity levels. Many participants show higher activity during daytime hours with noticeable reductions in the evening and night. Some participants display distinct “activity signatures” – regular patterns that might correspond to morning exercise routines, work schedules, or evening wind-down periods.
These temporal patterns provide valuable insights into how women with chronic pelvic pain organize their days and manage their condition. Understanding these rhythms helps our research team identify optimal times for potential interventions or activity modifications that might help manage pain while maintaining daily function.
Consistency and Engagement
The “Valid Days” metric shown for each participant reveals interesting information about study engagement. Some participants maintained remarkably consistent Fitbit usage throughout the study (94.9/98 valid days). Others show more gaps in data collection, which itself provides important contextual information about the challenges of continuous monitoring.
This consistency metric helps our research team understand barriers to data collection and points to opportunities for improving participant experience in future studies. It also reminds us that living with chronic pain can make consistent participation in research challenging.
The Bigger Picture
This comprehensive view helps researchers identify patterns that might not be visible when looking at individual cases. Additionally, the visualization helps identify “natural” movement periods that could be reinforced and extended. For hours showing lower sedentary time across participants, researchers might explore what activities are already occurring during these periods and how they might be encouraged.
The relationship between physical activity and chronic pelvic pain is complex but potentially critical for improving quality of life. Understanding these patterns is just the beginning of our research journey. By continuing to collect and analyze this data, we hope to develop increasingly effective, evidence-based recommendations for managing chronic pelvic pain through appropriate physical activity.
This is just one (and dare we say visually beautiful!) example of how direct patient input represents a powerful source of data that helps bridge the gap between clinical observations and real-world experiences. Your consistent wearing of Fitbit devices generates this valuable information that will ultimately lead to better understanding and treatment of chronic pelvic pain disorders.
To our participants: Thank you for your incredible commitment to this research. We are deeply grateful for the data you contribute that bring us closer to understanding the complex relationships unfold with chronic pelvic pain. Your participation doesn’t just generate colorful visualizations – it builds the foundation for developing more effective interventions and support for women living with these conditions.
We’d love to hear from you! Contact our research team to learn more about current and upcoming studies focused on improving quality of life for women with chronic pelvic pain disorders. If you’re not yet part of our study but live with chronic pelvic pain and would like to contribute to this important research, we’d love to hear from you. Together, we can continue mapping the patterns that will lead to better outcomes for everyone affected by these conditions.