
When you join a study, you see the front end—filling out surveys, wearing a Fitbit—but then what? What happens to your data?
Those data travel through secure systems and lands in my virtual lap. Hi, my name is Samia, and I’m the data analyst at Dr. Ensari’s lab, aka. the data wizard-in-residence. Today, I’ll walk you through what happens behind the scenes.
Data Don’t Arrive “Pretty”
When you think of research data, you probably imagine neat charts and organized numbers. But here’s a secret: data never start that way.
Think of it like cooking: you don’t throw ingredients from the grocery store straight into the oven. You wash, trim, measure, and prep everything first. Working with data is the same—we have to “prep” them before they can be analyzed, or “digested”. Curious to see what we mean?
The “Prep”
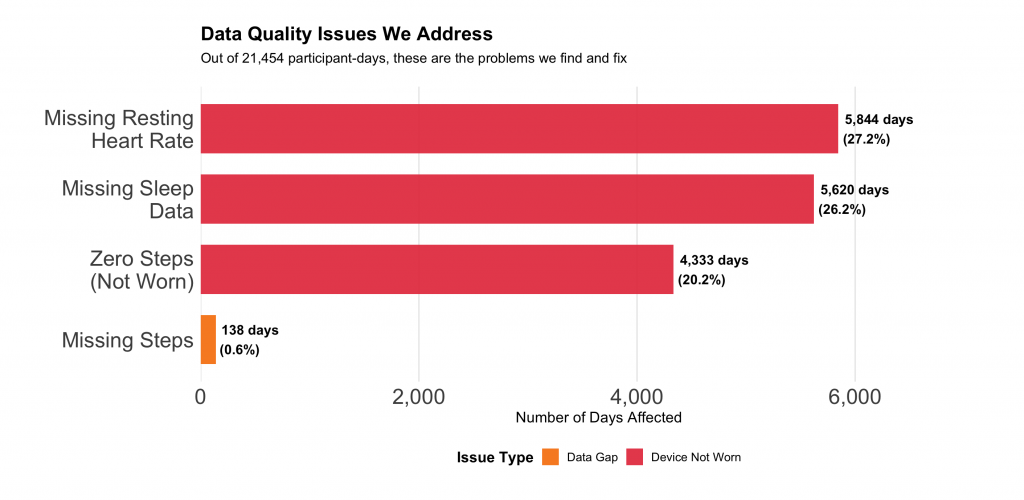
For example, this figure shows the Fitbit data from our participants in CPP Tracker study, which we recently completed. Out of 21,454 participant-days (229 participants × ~94 days each), we find:
- 20% of days have zero steps – device not worn or not charged
- 27% missing heart rate data – device needs snug fit to track
- 26% missing sleep data – device needs to be worn overnight
These aren’t errors—they’re real life. They could happen for a variety of reasons. The tracker might feel uncomfortable to sleep with so we take it off, or we take it off for a shower and forget to put it back on, or the sensor of the tracker moves away from where it needs to stay on the skin so it doesn’t pick up data. In summary, life happens, and that’s okay. The important thing is handling these gaps properly. So, what do we do next? We must complete a step called “weartime validation”.
Identifying Valid “Wear Days”
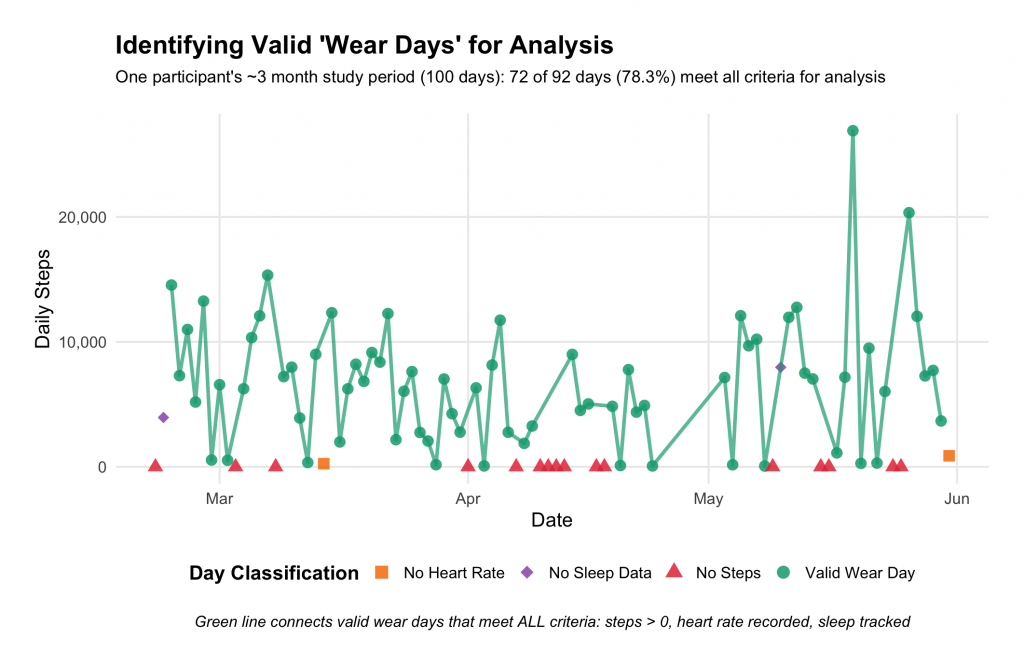
Given all the various ways life can happen, before we can analyze your Fitbit data, we first need to figure out: Did you actually wear your device that day? This is not always easy to determine because the Fitbit devices sometimes create “false positives”, aka. data points that look like activity but are in fact “artifacts” or noise. To make sure your data are accurately interpreted, we need to remove all the noise and keep the real signal, aka. true activity.
Let’s look at an example to understand this processing step in our “data kitchen”. See the green dots for this participant’s 3-month study period? Those are valid wear days (78% of days with data) where we have everything we need:
✅ Steps recorded (more than zero)
✅ Heart rate tracked
✅ Sleep data captured
But see those red triangles, orange squares, and purple diamonds scattered throughout? Those tell a different story:
- Red triangles = No steps → Device not worn that day
- Orange squares = No heart rate data → Device not worn properly
- Purple diamond = No sleep data → Device not worn overnight
Why does this classification matter?
First, for noticing any prominent patterns—like those clusters of red triangles in early April. Maybe you went on vacation and decided to take a break from the device. Maybe you were sick. Maybe the device was uncomfortable. It is not always possible to determine the reason and as the data wizard, I conduct specialized analyses to pare down to the most likely scenario. This is also why our team maintains regular contact with our participants throughout the study and sends out reminders or updates. We want your data to have the maximum possible impact. If we can see it in the data, it helps us understand your study participation.
Second, for accurate analysis, which is crucial in research. Therefore when we’re studying how activity affects pain for example, we strive to use days with reliable data. If we included days where the device was sitting on your nightstand, we’d be analyzing nothing—and that would throw off all our findings.
The green line connects those valid wear days, showing your real activity patterns when the device was doing its job.
Prepping The Sleep Data
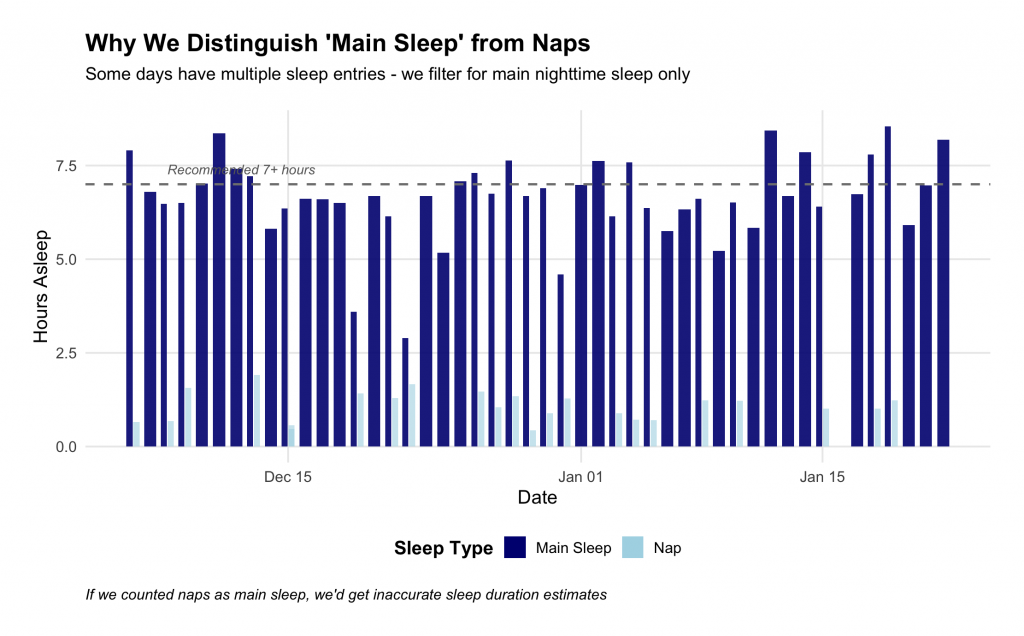
Your Fitbit records every sleep session—including naps. Some days have 2-3 sessions recorded: nighttime sleep, a midday nap, maybe dozing on the couch.
Therefore, we first determine which of these sessions are needed for the specific research question we are investigating. In our example with CPP Tracker, we need only your main sleep (i.e., defined as the longest sleep bout and typically occurs overnight). If we accidentally used your 30-minute nap instead of your 7-hour night, our analysis would be way off. So we make sure that the analyses are not distorted by days when your Fitbit was charging on the counter or accidentally counting your afternoon nap as nighttime sleep.
We filter for main nighttime sleep (the Fitbit tags this for us) and track naps separately. This ensures we’re measuring the right thing when we study how sleep quality relates to your other health markers such as pain.
Why This Matters
Your participation is valuable – you’re sharing months of personal health data. We handle it with care. Behind every research finding are hours of careful data preparation.
As the data analyst, I take the messy, real-world data from your everyday life and translate it into interpretable information. It is this interpretation that allows us to discover patterns in the data, such as which approaches might help with your pain. Once we have reliable, consistent patterns and valuable findings, we can then “bring out the dish from the kitchen”, which is the final stage where we publish and share the research findings with you all.
Thank you for trusting us with your data. We don’t take that responsibility lightly.