
Welcome back to Data Bytes. Today we are going to talk about an interesting question in our “Daily Check-In” survey on the ehive App called “how was your day”.
Chronic pelvic pain is more common and disruptive than most people realize. A 1996 population study estimated that roughly one in seven U.S. women between 18 and 50 live with it, and even then researchers noted that the harder thing to capture wasn’t pain intensity but interference: how pain quietly reshapes what a person can do on any given day.¹ That gap between “how bad does it hurt” and “what did it actually cost you today” is still difficult to measure in a clinical settings.
It’s also exactly what we’ve been trying to get at in the CPP Tracker study, through the question below:
“Would you say your quality of day is: poor, fair, good, very good, or excellent?”
It’s a simple question but when you pool thousands of daily answers, it turns out to be a surprisingly honest read on what pain interference does to a person’s day.
Two very different ideas of “a normal day”
The CPP Tracker study includes both people with chronic pelvic pain and a comparison group without it, and everyone answers the quality-of-day question daily over 15 weeks. Here’s what those distributions looked like in aggregate:
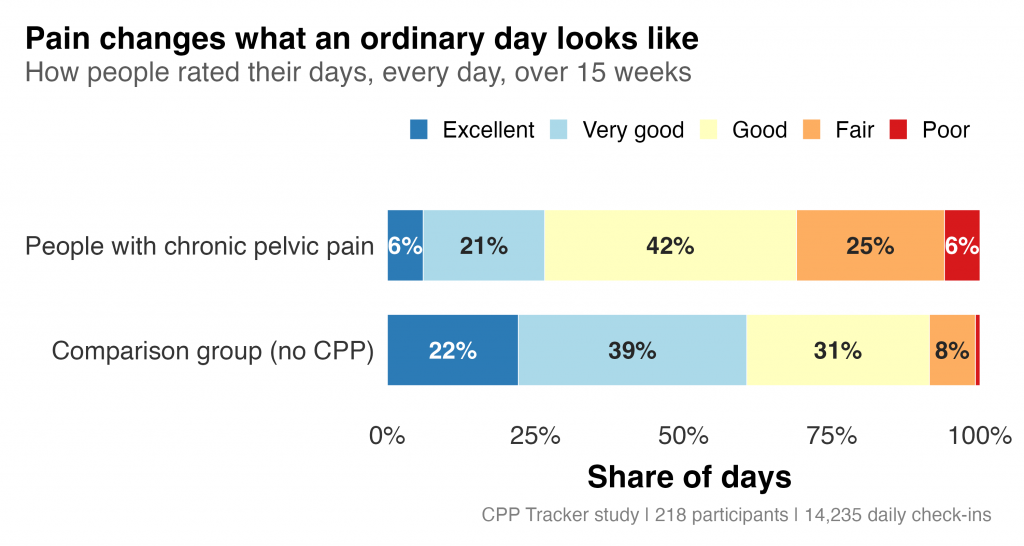
For the comparison group, about 6 in 10 days landed in the “very good” or “excellent” range. For people with CPP, the picture is almost inverted — the largest single slice is the middle category, and about 1 in 3 days came in at “fair” or below. There is not as many responses for excellent quality of day for the CPP group.
Pain interference tracks quality of day closely
Once a week, participants also answered a pain interference questionnaire. This questionnaire does not rate pain explicitly, but whether pain got in the way of things like concentrating, keeping up with daily tasks, running errands, and spending time with others. We matched those weekly scores against how participants rated their days that same week.
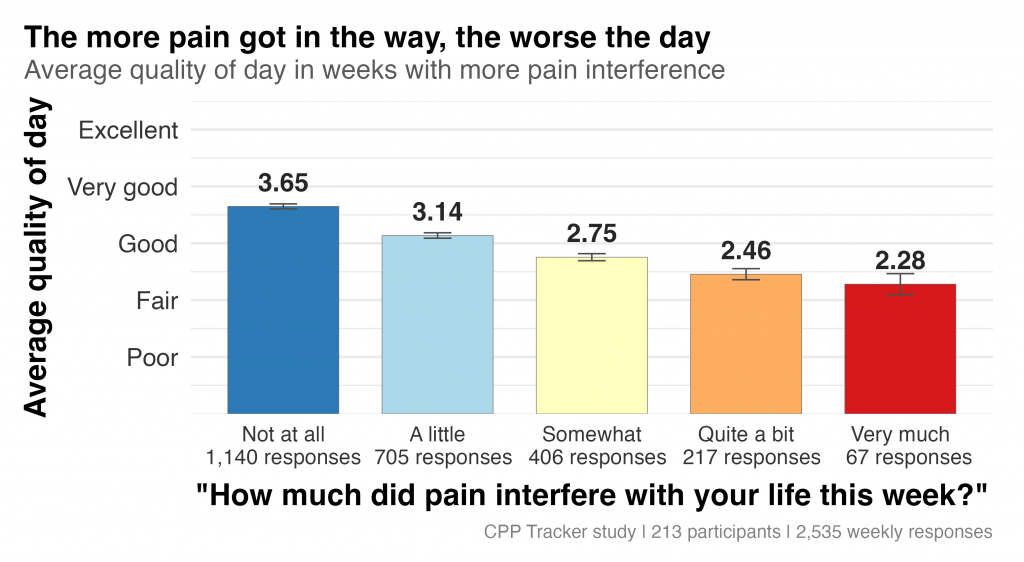
The relationship is remarkably clean. In weeks when pain didn’t interfere at all, average day ratings hovered around “good” to “very good” (mean 3.65 on a 1–5 scale). As interference increased — a little, somewhat, quite a bit, very much — quality of day dropped at every step, landing near “fair” in the highest interference weeks. That’s a meaningful drop across just five response categories, based on 2,535 weekly responses from 213 participants.
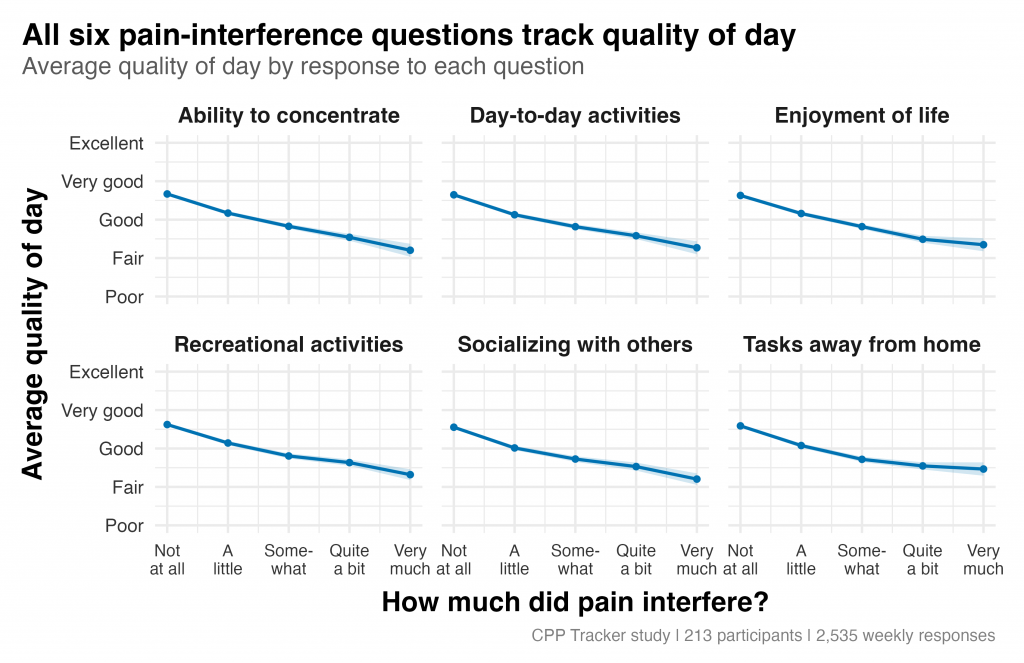
We also checked whether this was driven by one or two items in the interference questionnaire, or whether it held across the board. It held across the board — all six items (ability to concentrate, day-to-day activities, enjoyment of life, recreational activities, socializing with others, tasks away from home) showed the same monotonic decline.
Why this matters
There’s a reason that researchers have used interference — not intensity — as the central measure of pain burden in CPP for decades. The study that put the one-in-seven prevalence figure on the map also found that women with CPP reported significantly lower general health scores and greater interference with daily activities compared to those without it.¹ More recently, work applying PROMIS measures to CPP patients found that sleep disturbance, pain behavior, and pain impact were the domains most deviated from population norms — with physical function and social satisfaction also significantly impaired.²
What our data add is an efficient, low-cost way to assess interference in real time, outside the clinic. “How was your day” turns out to be a reasonable shorthand for a lot of the same ground those longer instruments cover — and it takes about two seconds to answer.
In research terms, we are using these combined data to validate this new digital measure for individuals living with chronic pelvic pain—to test whether it is reliable, sensitive, and aligned with both clinical understanding and lived experience.
Why “validation” is more than a buzzword
It’s easy to get excited about the idea of “real‑time data” from apps and wearables, and many talks and headlines stop there. But without careful validation, numbers on a dashboard are just that: numbers. Validation work asks questions like the ones we are asking, e.g., If your pain gets worse, do the measures change in a way that reflects that?. This means collecting repeated data, checking for consistency, and being meticulous about how each question is designed and tested. But without it, we risk building tools that look impressive on a slide and are not very helpful in real clinics or in real lives. As a participant, you are helping us shape what better measurement looks like for this condition and we are deeply grateful for your dedication and enthusiasm in contributing to this research.
Data Bytes | Samia Shahnawaz, Data Analyst II
References
- Mathias SD, Kuppermann M, Liberman RF, Lipschutz RC, Steege JF. Chronic pelvic pain: prevalence, health-related quality of life, and economic correlates. Obstetrics & Gynecology. 1996;87(3):321–327.
- Fenton BW, Palmieri P, Diantonio G, Vongruenigen V. Application of Patient-Reported Outcomes Measurement Information System to chronic pelvic pain. Journal of Minimally Invasive Gynecology. 2011;18(2):189–193.