
Welcome to Data Bytes, where we share data insights from our ongoing research. This week’s visuals are courtesy of our in-house data analyst Samia Shahnawaz from the CPP Tracker study.
Have you ever wondered how your sleep duration may be related to when you go to bed? Or whether your urge to nap might be influenced by your bedtime or waking times? This week, we are sharing insights from the ongoing CPP Tracker study using the Fitbit Tracker data of our participants. As always, these are aggregated results from all of our study participants and do not depict any personally identifiable data points. With this disclaimer out of the way, let’s look at what we have discovered about the collective sleep habits of our participants!
We visualize the data using two separate figures which plot the same data, but highlighting different aspects of the data patterns.
The first chart below shows when our participants went to bed and how long they stayed in bed. The orange dots represent their main sleep periods (typically your overnight sleep from one night to the next morning). The blue dots show what Fitbit labels as “secondary” sleep, typically what we would consider naps or “I just closed my eyes for a second!”. Each dot’s position tells us the bedtime (along the x-axis) and the hours spent in bed (along the y-axis).
Bedtimes and Durations
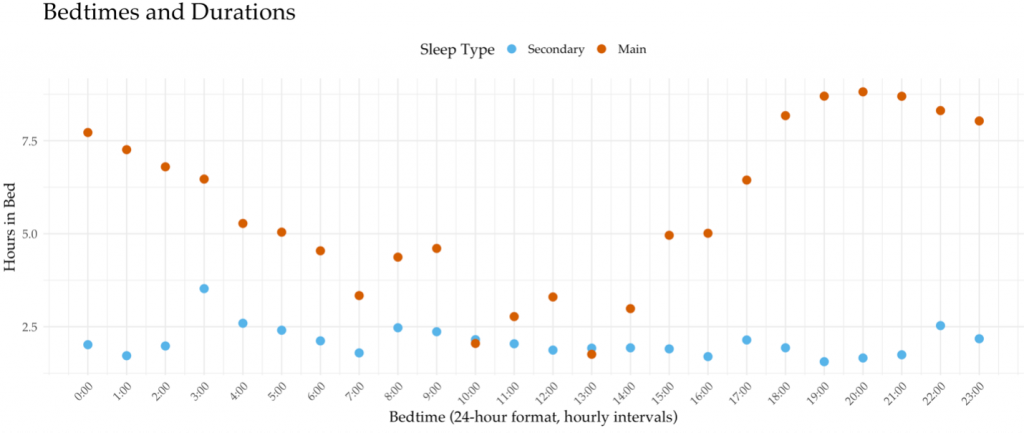
For example, we can see that people who went to bed around 10:00 PM (22:00) generally stayed in bed a little over 7.5 hours. Meanwhile, those who went to bed at 5:00AM or 6:00AM stayed in bed for 5 hours or less. This makes sense as we typically have fewer hours to sleep before we need to get up and go to work! There are a few overlapping blue and orange dots in the middle of the chart, which are interesting as they could indicate individuals who tend to have scattered sleeping patterns throughout the day.
Going deeper into sleep patterns
The second plot below shows the same data, but there is a 2nd y-axis on the right: We now see how frequently these bedtime-sleep duration pairs occur over the 3-month study period. These are indicated by the very thin green bars.
Each green bar represents the frequency of bedtimes at a specific hour; the taller the bar, the more times people went to bed at that hour. The scatter points on the plot show the average sleep duration for each bedtime hour, with light pink points representing main sleep (primary sleep sessions) and light blue points representing secondary sleep (naps or additional sleep sessions).
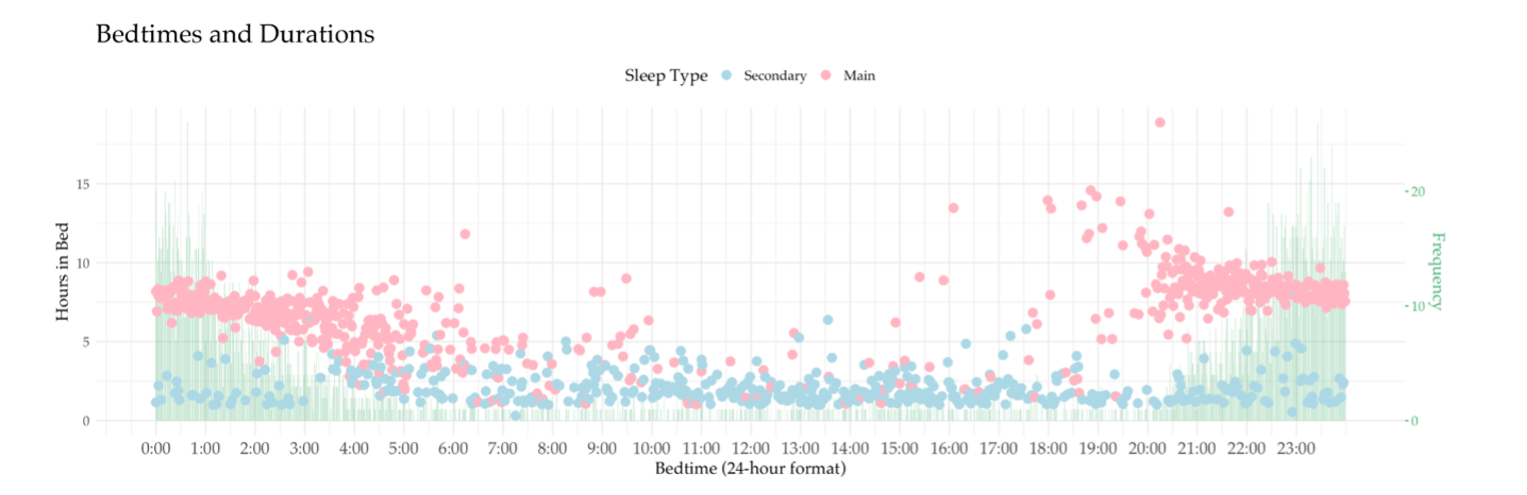
The x-axis represents the time when people go to bed, displayed in a 24-hour format from midnight (0:00) to 11 PM (23:00). The left y-axis indicates the average number of hours people spend in bed. The right y-axis shows how often people go to bed at different times.
For example, if you see a light pink point at 11 PM (23:00) and 8 hours on the y-axis, it means that on average, people who went to bed at 11 PM slept for about 8 hours. Similarly, the green bar at 10 PM (22:00) shows how often people went to bed at that time; a taller bar indicates a higher frequency of bedtimes at 10 PM.
This 2nd plot helps us understand both the frequency of bedtimes and the average sleep durations for many people over a long period. By visualizing the average hours in bed and the common bedtimes, we gain valuable insights into the diverse sleep behaviors of the participants.
These plots give us a fascinating glimpse into the sleep patterns of our participants. Whether you’re an early bird or a night owl, these findings highlight the diversity in sleep habits and how they can change over time. Join our study to help us uncover more insights and maybe even improve your own sleep habits! Sweet dreams and good mornings, everyone!
This Data Byte is part of the CPP Tracker study.